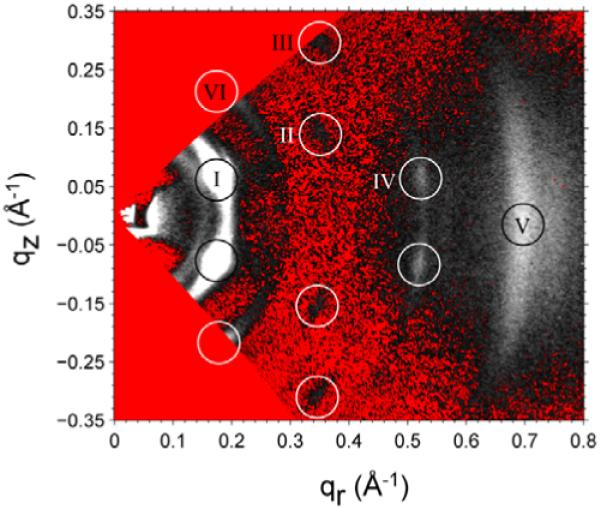
Figure 16.

Transmission scattering for Alm:DOPC 1:10 at D=43 Å with sample rotated by α=45° and converted to q-space. The two triangular (red online) regions of q-space, one in the upper left and one in the lower left, touching at q=0, are inaccessible in this transmission geometry. The scattering peaks are indicated by open white circles and are given roman numeral names. Peak VI was observed using α=30°. The white intensities are brightest, and the red (color online) pixels correspond to the smallest intensities after background subtraction. Peaks II and III appear darker than the surrounding background in the non-color figure.
