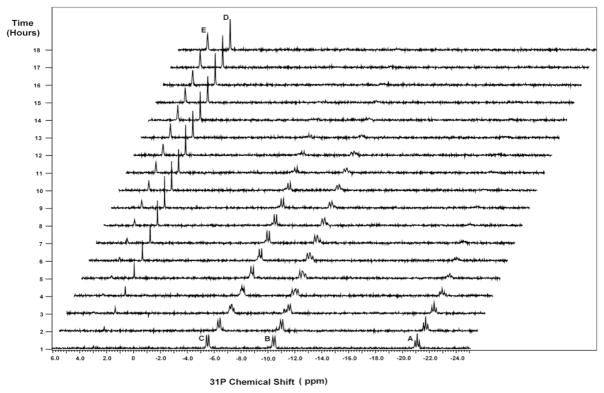
Figure 1.
A representative 31P kinetic spectrum of myosin catalyzed ATP, obtained with 5 mM ATP at pH 7.0 and 21°C. The vertical axis shows timings for spectral acquisition. The peaks are assigned as: A (β-ATP); B (α-ATP and α-ADP); C (γ-ATP and β-ADP); D (Pi); E (AMP). The ATP hydrolysis can be characterized by decline of β-ATP. Subsequent ADP hydrolysis is also observable from the spectrum.

