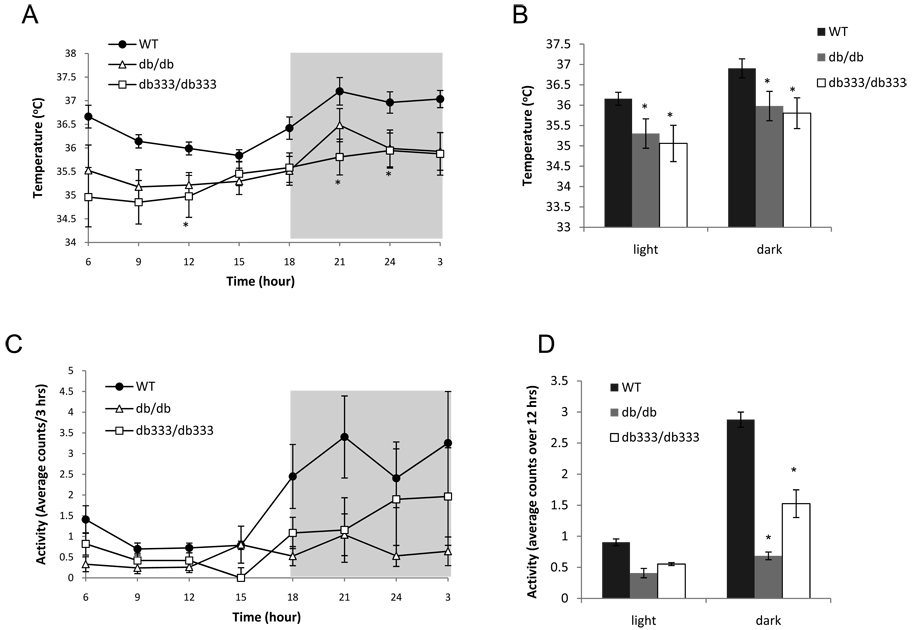
Figure 5. Core Body Temperature and spontaneous locomotor activity in db333/db333, db/db and WT mice during a 24hr monitoring period.
A. db333/db333 and db/db mice display a significantly lower core body temperature relative to WT mice B. Average core body temperature over the 12hr light or dark cycle in db333/db333 and db/db mice is significantly lower when compared with WT littermates C. Average spontaneous physical activity of db333/db333 db/db and WT mice during a 24hr monitoring period. db333/db333 and db/db mice display decreased locomotor activity relative to WT mice. D. Averaged activity for db333/db333, db/db and WT mice during the light and dark cycle. Both db333/db333 and db/db mice display lower average activity than WT mice. Data are plotted as mean ± SE for n = 4 animals of each genotype. Significant (P<0.05) differences between group means are denoted by asterics and were determined by one way ANOVA and post hoc Tukey test.

