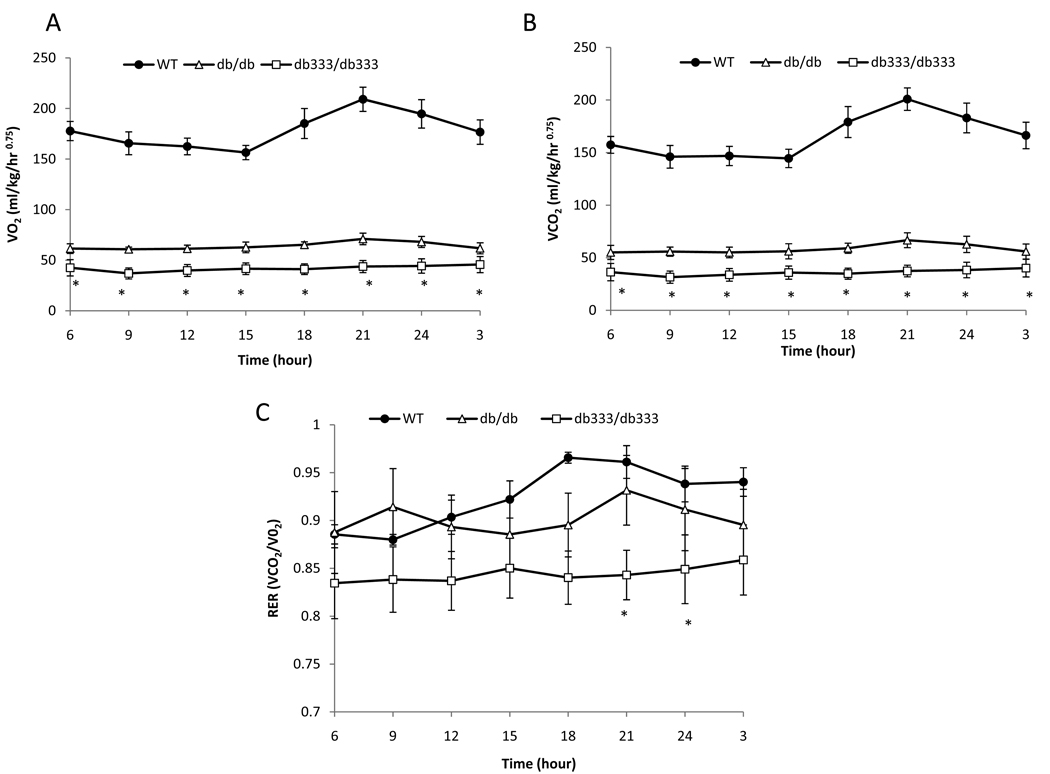
Figure 7. Metabolic comparison of db333/db333, db/db and WT mice during a 24hr monitoring period.
A. Oxygen consumption in db333/db333, db/db and WT mice monitored for 24hrs. Both db/db and db333/db333 mice displayed similar oxygen consumption at all time points and these obese mutants showed significantly lower oxygen consumption than WT mice throughout both the light and dark cycle. B. CO2 production in db333/db333, db/db and WT mice monitored for 24hrs. Both db/db and db333/db333 mice displayed similar levels of CO2 production at all time points and these obese mutants showed significantly lower CO2 production than WT mice throughout both the light and dark cycle. C. Respiratory Efficiency Ratio (RER) (VCO2 /VO2) in db333/db333, db/db and WT mice over a 24hr period. Both db333/db333 and db/db show a trend of lower RER relative to WT mice that is most pronounced in the dark cycle. db333/db333 mice show a consistently lower RER relative to db/db and WT mice. Data are plotted as mean ± SE for n = 4 animals of each genotype. Significant (P<0.05) differences between group means are denoted by asterics and were determined by one way ANOVA and post hoc Tukey test.

