Figure 5.
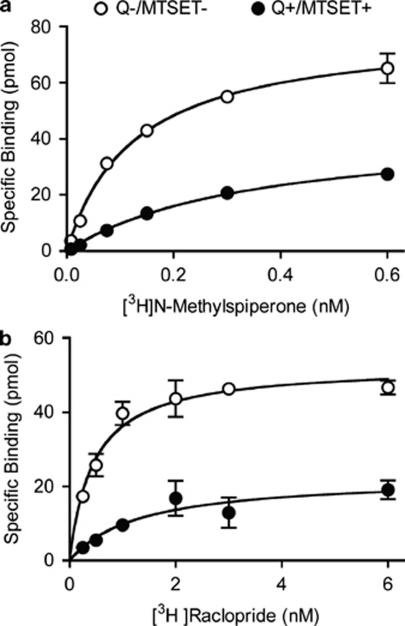
Saturation binding to surface and internalized D2 receptors. (a) Under control conditions, when most receptors are on the surface, [3H]NMSP saturation binding showed a one-site binding curve with a KD of 0.12±0.02 nM (○, Q−/MTSET−). Following quinpirole and inactivation of surface receptors with MTSET, the remaining functional internalized D2 receptors showed a one-site binding curve with a lower-affinity KD of 0.48±0.13 nM (•, Q+/MTSET+). On the basis of the reduction in the Bmax, ∼50% of D2 receptors underwent internalization. (b) Under control conditions, [3H]raclopride saturation binding showed a KD of 0.5±0.1 nM. Following quinpirole and MTSET, binding showed a lower-affinity KD of 1.2±0.2 nM. On the basis of the reduction in Bmax with raclopride binding, ∼40% of D2 receptors underwent internalization.

