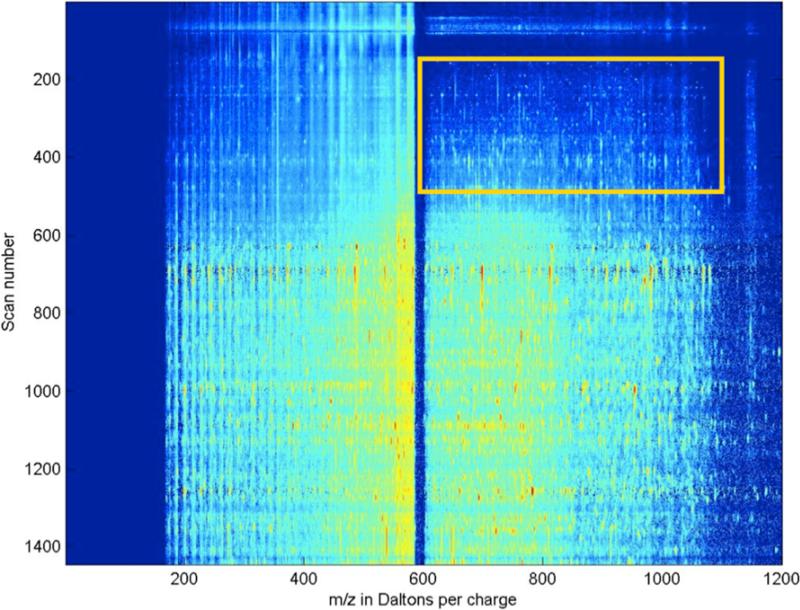
Figure 2.
Data from data-independent acquisition (DIA) plotted as a heat map. In this heat map, color is proportional to log ion counts. The X-axis is the m/z of the product ions formed from the isolation and activation of molecular species with precursor m/z between 590 and 600. The Y-axis is the scan number. Our DIA strategy cycled through ten of these 10-m/z ranges, completing each cycle in about 2 seconds; a 50-minute LC run gives about 1500 scans for each precursor window. Because the MS/MS spectra were acquired using frequency based activation, all precursor and product ions within the isolation window, in this case m/z 590 – 600, were fragmented to completion. Thus, product ions expected within this relatively large isolation window would not be observed.

