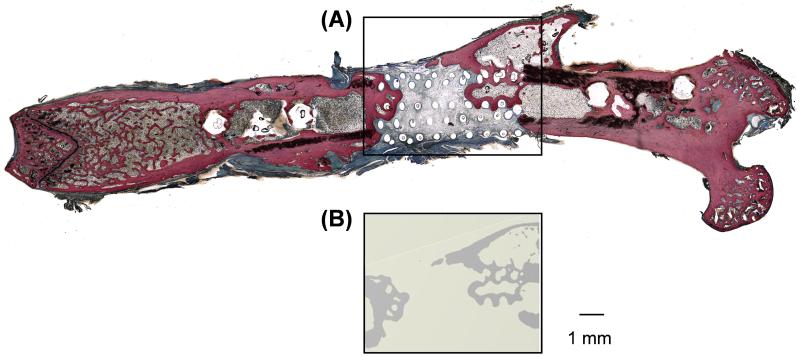
Figure 4.
Histological analysis confirms that areas of high attenuation revealed by microCT are bone tissue. (A) Sanderson’s rapid bone stain for a GFOGER-coated sample showing bone in red/orange and soft tissue in blue/green. (B) Two-dimensional microCT image from the same sample as (A) revealing bone formation in the same location.

