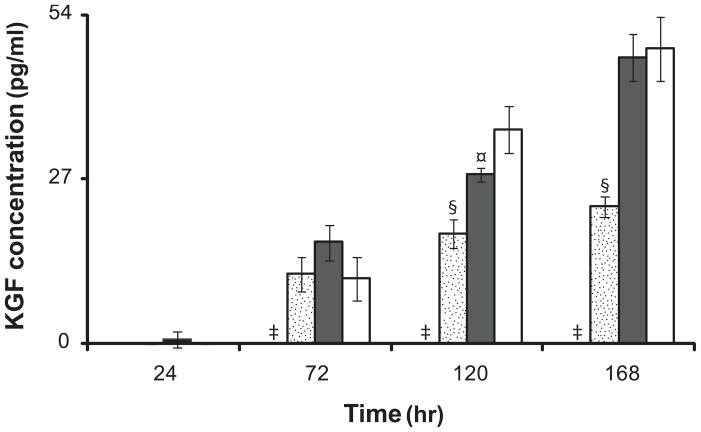
Figure 2.
KGF release from fibroblasts cultured on TCPS in FBM ( ), FBM+2% FBS (
 ), FBM+5%FBS (
 ), and FGM-2 (□). Serially transitioned cells were cultured on TCPS in serum-free and serum-containing media. FGM-2 served as a positive control using cells which did not undergo serial transitioning. KGF concentrations in cell culture supernatant from 24 to 168 hours were measured by ELISA. All data presented as average ± standard deviation (n=3).
‡: Significantly different compared to FBM+2%FBS, FBM+5%FBS, and FGM-2 at the same time point, p < 0.05.
§: Significantly different compared to FBM+5%FBS, and FGM-2 at the same time point, p < 0.05.
¤: Significantly different compared to FGM-2 at the same time point, p < 0.05.

