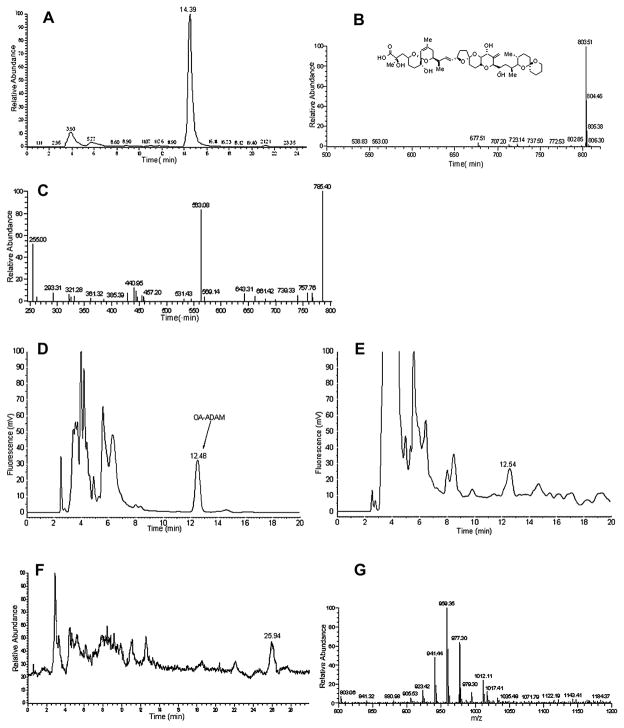
Fig. 2.
A. The chromatogram of P. rhathymum extract monitored for m/z 803.5. B. MS spectrum of 14.39 min. peak from Fig. 2A. C. The LC-MS/MSof the m/z 803.5 ion as the precursor. D. HPLC-FLD analysis for reaction of “in situ” ADAM reagent system with 8.65 ng of an okadaic acid standard. E. HPLC-FLD analysis for reaction of “in situ” ADAM reagent system with P. rhathymum supernatant extract. F. Total ion chromatogram (TIC) of the “in situ” ADAM reaction of P. rhathymum supernatant extract. G. MS spectrum of 25.94 min. peak from Fig. 2F.

