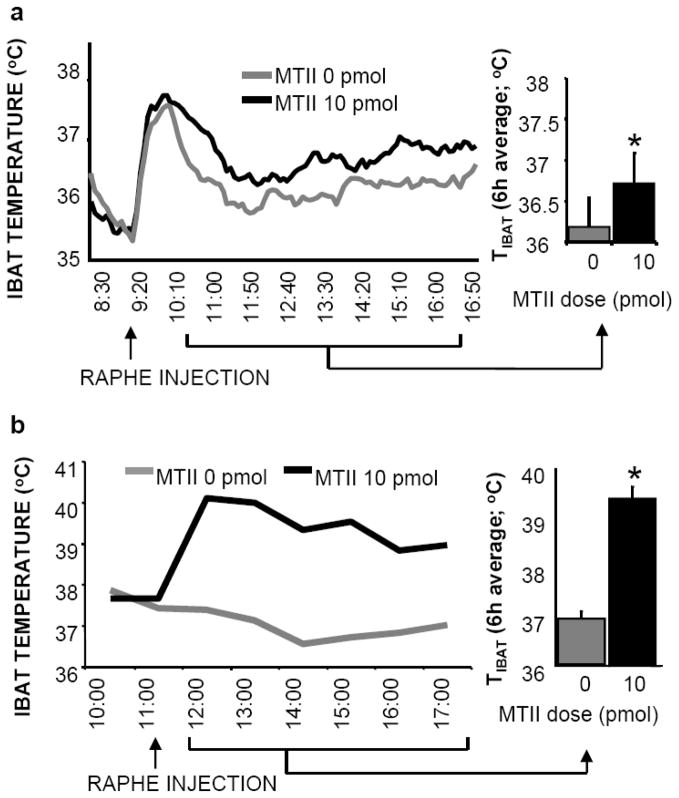
Figure 10.
10 pmol MTII stimulation of medullary raphe MC4-Rs produces hyperthermia in both intact rats (a) and chronic decerebrate rats (b). Line graphs represent across-rat average parameter measurements through the 8-h recording period. The bracketed time period on the line graph x-axis indicates the periods used in the histograms. Histograms in represent 6-h means + SEM. *, P < 0.05.

