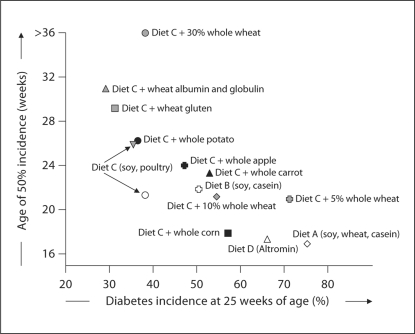
Fig. 3.
The effects of the different diets on the rate of diabetes development. Diabetes incidences at 25 weeks of age in female NOD mice (x-axis) are plotted in relation to the age of 50% diabetes incidence (y-axis) for each individual dietary intervention group. For a direct comparison, the groups of each intervention protocol are shown in one plot. The treatment groups of intervention protocol A with respect to various protein sources to establish a lowdiabetogenic diet are indicated by transparent symbols, of intervention protocol B1 with respect to wheat and wheat components to investigate the diabetogenic effects of wheat proteins are indicated by shaded symbols, and of intervention protocol B2 with respect to foods encountered in early infant diet to investigate their diabetogenic effects are indicated by filled symbols.

