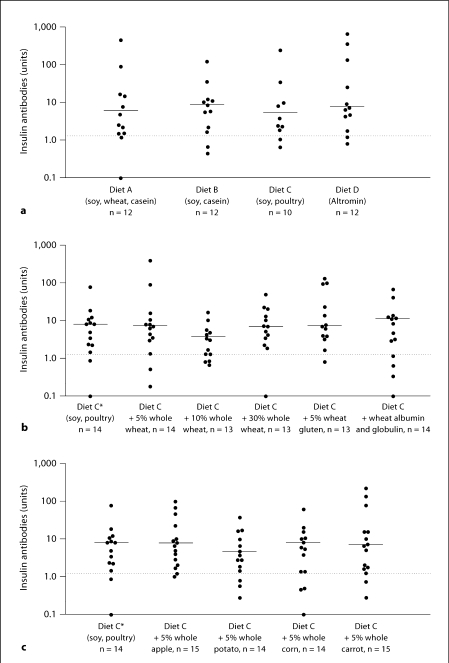
Fig. 4.
Insulin autoantibody prevalence and titer at 10 weeks of age in female NOD mice treated under dietary intervention protocol A with respect to various protein sources to establish a low-diabetogenicdiet (a), dietary intervention protocol B1 with respect to wheat and wheat components (b), and dietary intervention protocol B2 with respect to foods encountered in early infant diet (c). The same group of mice fed with diet C without supplements has been used in b and c, and is indicated with an asterisk. The dotted lines indicate the cutoff for positivity. The horizontal lines indicate the mean insulin autoantibody titer per treatment group.

