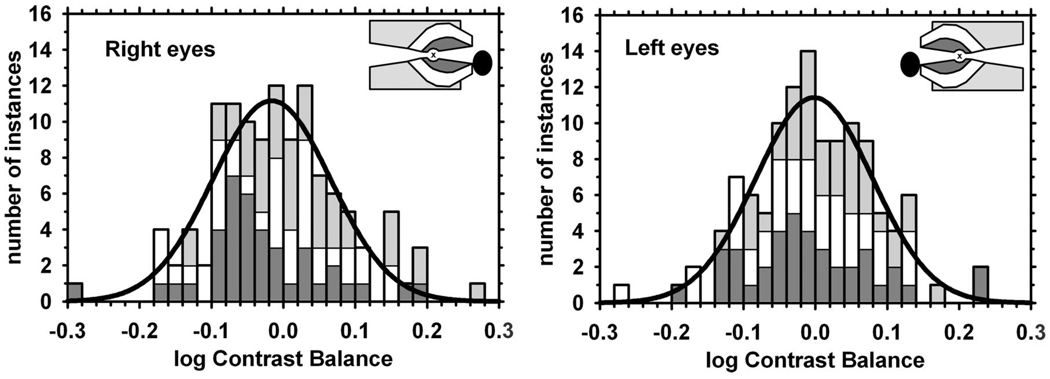
FIGURE 1.
Distributions of all weighted mean values of log contrast balance for the right and left eyes of normal subjects. Means: −0.009, −0.003; SDs: 0.094, 0.100. The distributions are normal according to both K-S and S-W tests. Histograms are shown for the data; smooth curves are the best-fit normal distributions. Insets are scale diagrams of the three stimulus pairs for right and left eyes, indicating the fixation target (“x”) and the blind spot. Histogram and stimulus shading indicate: paracentral stimulus (dark gray), Bjerrum stimulus (white), peripheral stimulus (light gray).

