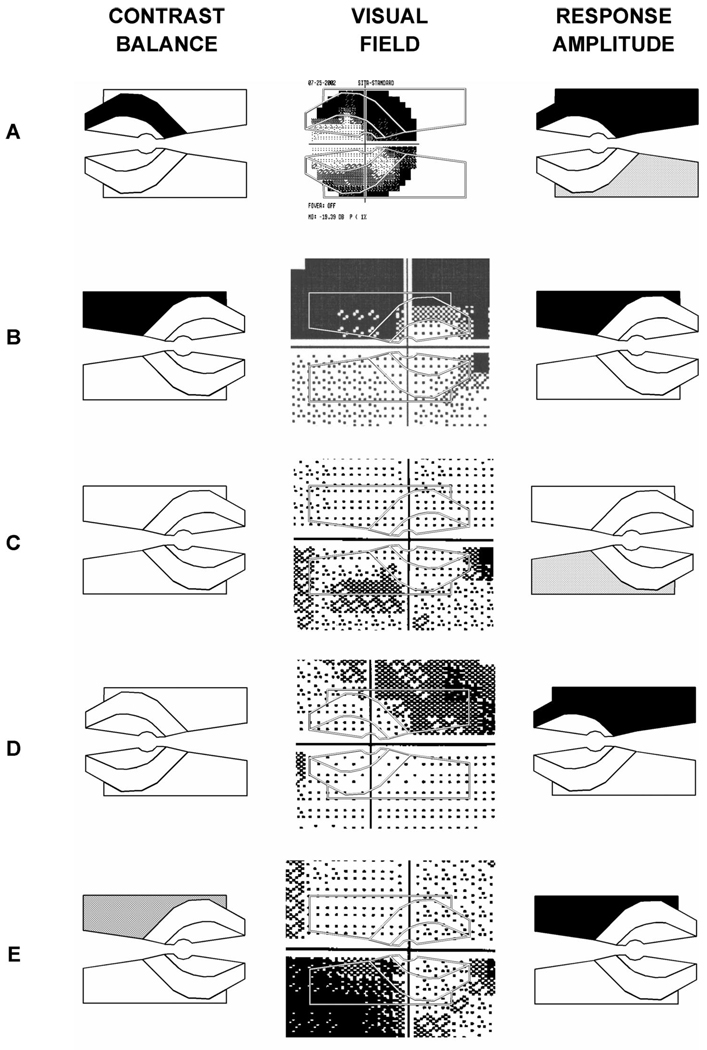
FIGURE 3.
Five examples of grayscale representations of pupil defects from patients (left column), compared with visual field data (center column). Right column shows amplitude results for the same eyes (see text). The example shown at the bottom is the only case in 79 eyes where the pupil defect was clearly opposite to the prediction from perimetry.

