
Fig. 4.
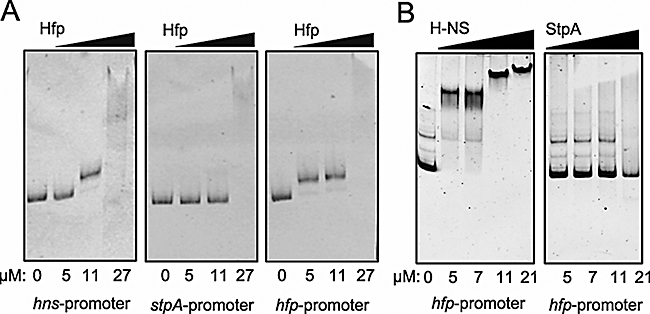
DNA-binding pattern of Hfp, H-NS and StpA to cognate promoter regions determined by electrophoretic mobility shift analysis. A. Binding activity of purified Hfp protein to PCR-generated DNA fragments spanning the promoter regions of hns, stpA and hfp. The figure represents ethidium bromide-stained acrylamide gels after digital inversion of the images. Protein was added at the concentrations indicated below each lane in a range from 0 to 27 µM. B. Comparison of DNA-binding affinities of H-NS and StpA at the hfp promoter region. The assay was carried out as described before, using the same DNA fragment as in (A). The purified proteins were added in a concentration range of 0–21 µM. Images depict representative gels of at least two independent experiments.