Fig. 7.

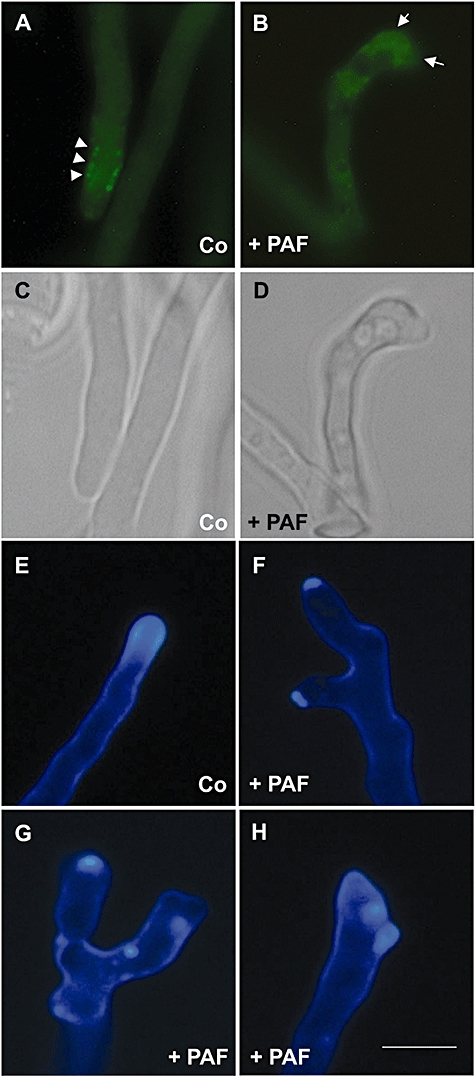
Fluorescence micrographs showing actin and chitin distribution in A. nidulans hyphae in response to PAF treatment (+PAF) (B, D and F–H) compared with untreated controls (Co) (A, C and E). (A–D) shows the transgenic A. nidulans strain expressing actin-GFP (Taheri-Talesh et al., 2008). (A) In the untreated control, characteristic actin patches at the subapical region of the hyphal tip are visible (white arrow heads). (B) When exposed to 50 μg ml−1 PAF, no actin patches were detectable and transition from polar to apolar growth became evident (white arrows). (C and D) Light micrographs of (A) and (B) respectively. (E–H) shows CFW staining of A. nidulans FGSC4A. (E) The untreated control sample exhibits a characteristic cap-like CFW fluorescence at the hyphal tip which corresponds to the site of chitin assembly. (F–H) Incubation with 50 μg ml−1 PAF induces hyperbranching (F) a reduced chitin content and (G and H) a delocalized chitin deposition at the hyphal tips. Scale bar, 10 μm.
