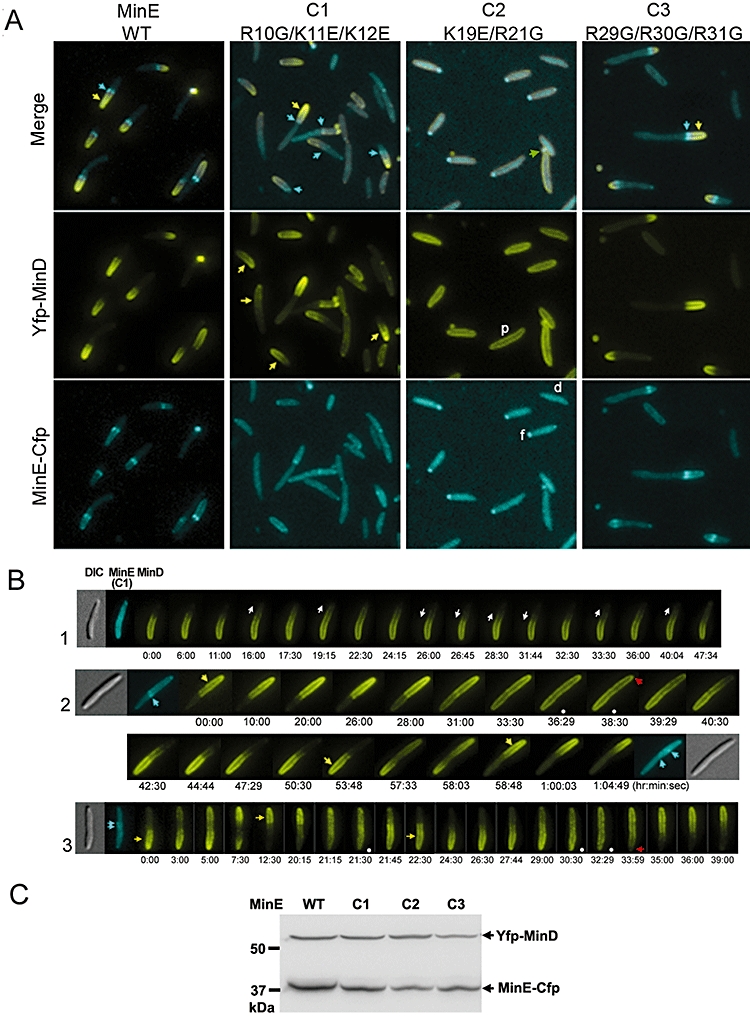
Fig. 5.

Effects of the N-terminal mutations on the localization of MinD and MinE. A. Colocalization of MinD with MinE lacking various positively charged residues (mutants C1, C2 and C3). p: peripherally localized MinD; d: diffusely distributed MinE; f: MinE focus. Yellow and cyan arrows indicate the MinD polar zones and the MinE rings respectively. The green arrow points out a fluorescent spot found in a minicell. B. Movement of MinD fluorescence in the presence of the C1 mutant MinE. The top cell started to disassemble MinD at one pole. White arrows indicate directions of polar zone growth and shrinkage. Another two cells showed atypical oscillation with a peculiar stage of MinD on the entire periphery of the cells (frames marked by the white dots) before re-initiating disassembly from the extreme cell pole (red arrows). C. Western blot analyses using the anti-Gfp antibody to detect levels of Yfp-MinD and MinE-Cfp in cells. The anti-Gfp antibody used here displayed different abilities to recognize Yfp and Cfp, thus the band intensity did not reflect the real ratio of Yfp-MinD to MinE-Cfp in cells.
