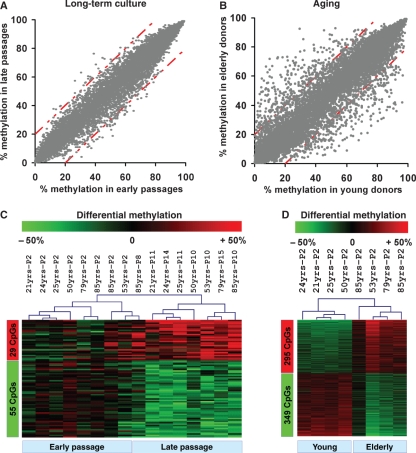
Fig. 1.
CpG methylation changes upon long-term culture and aging. DNA methylation at 27 578 different CpG sites was analyzed using the HumanMethylation27 BeadChip microarray. Scatter plots represent the mean methylation levels of mesenchymal stromal cells from early passage vs. late passage (A) or of young vs. elderly donors (B). Differential methylation of more than 20% was considered to be relevant and this is demonstrated by the dashed red lines. Heat map presentation of differentially methylated CpGs in long-term culture (C) and aging (D) are shown. Notably, unsupervised hierarchical clustering of CpG sites that revealed differential methylation in long-term culture revealed an age-associated relationship of methylation profiles.

