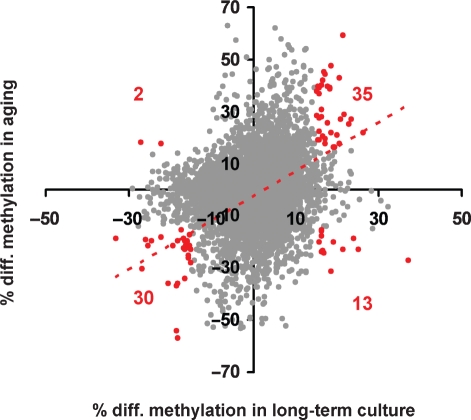
Fig. 3.
Comparison of differential methylation upon long-term culture and aging. Methylation changes upon long-term culture were plotted against methylation changes upon aging. CpGs with a more than 15% differential methylation in both comparisons are depicted (red spots). These differentially methylated CpGs revealed that DNA methylation changes upon long-term culture and aging are overlapping (correlation coefficient R = 0.61; P = 4.6 × 10⁹).

