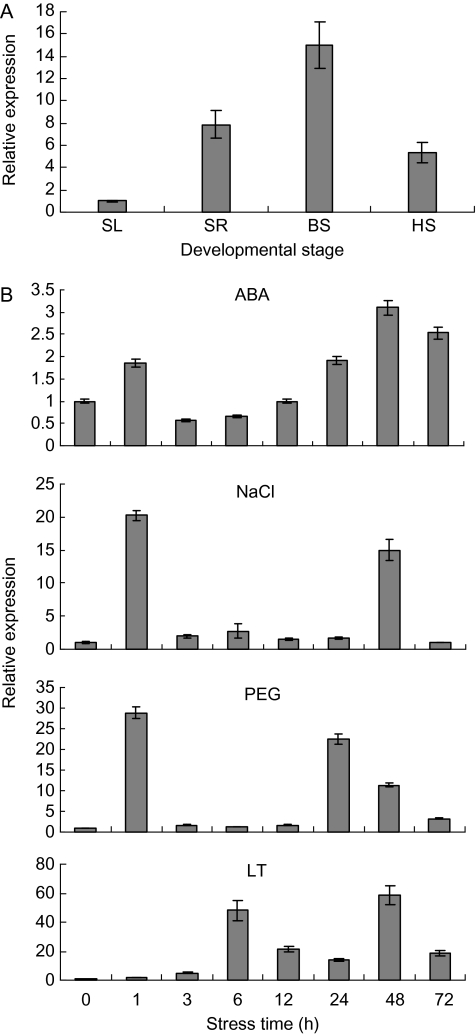
Fig. 2.
Expression patterns of TaSnRK2.4. (A) Expression patterns of TaSnRK2.4 in wheat tissues at different developmental stages. SL, seedling leaf; SR, seedling root; BS, booting spindle; HS, heading spike. The 2–ΔΔCT method was used to measure the relative expression level of the target gene, and the expression of TaSnRK2.4 in seedling leaves was regarded as the standard for its lower level. (B) Expression patterns of TaSnRK2.4 under ABA, salt (NaCl), PEG, and low temperature (LT) treatments. Two-leaf seedlings of common wheat cv. Hanxuan 10 were exposed to abiotic stresses as described in the Materials and methods. The 2–ΔΔCT method was used to measure the relative expression level of the target gene, and the expression of TaSnRK2.4 in non-stressed seedling leaves was regarded as the standard. Means were generated from three independent measurements; bars indicate standard errors.

