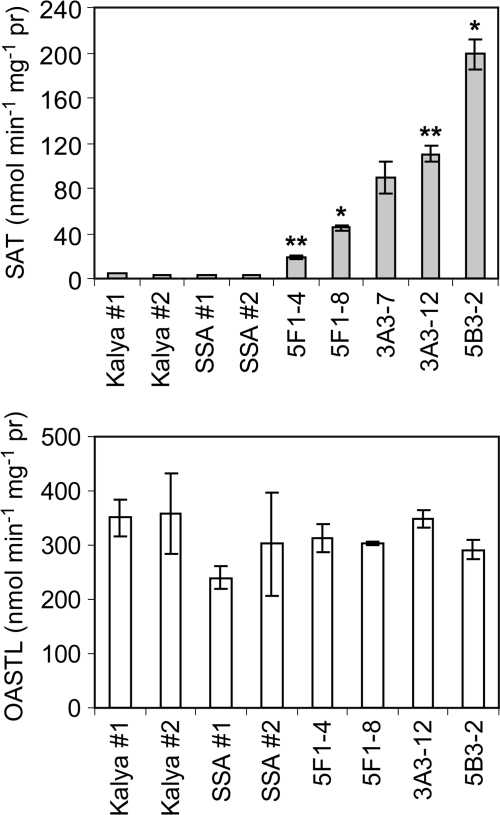
Fig. 2.
SAT and OASTL enzyme activities in developing embryos of T2 transgenic narrow leaf lupins and controls. Each bar represents the mean ±SE for T2 embryos from one T1 transgenic plant. Between two and five technical replicates were performed, with extracts from 1–5 independent subsamples of embryos for each T1 plant. Symbols indicate the significance of the differences between each mean value and that of the wild-type control, cv Kalya (#P <0.1; *P <0.05; **P <0.01). Kalya #1 and #2 and SSA #1 and # 2 represent measurements for pooled embryo extracts for two separate plants of either the non-transgenic control Kalya or a transgenic lupin line homozygous for the SSA transgene.

