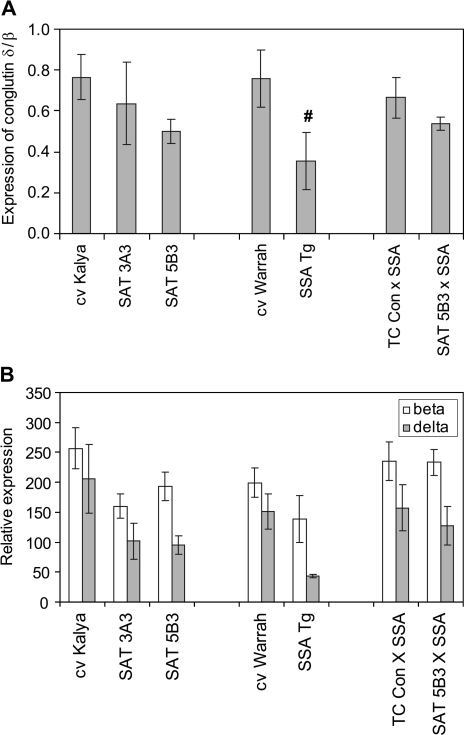
Fig. 5.
Relative abundance determined by qRT-PCR of transcripts for sulphur-rich conglutin δ and sulphur-poor conglutin β in developing transgenic lupin embryos expressing SAT and/or SSA. (A) Ratios of the relative abundance of conglutin δ/conglutin β. (B) Relative abundance of each conglutin alone (relative to the normalizing gene for a putative 60S ribosomal acid protein P1). Each bar represents the mean of three biological replicates ±SE; the symbol indicates the significance of the differences between each mean value and that of the wild-type control, cv Kalya (#P <0.1).

