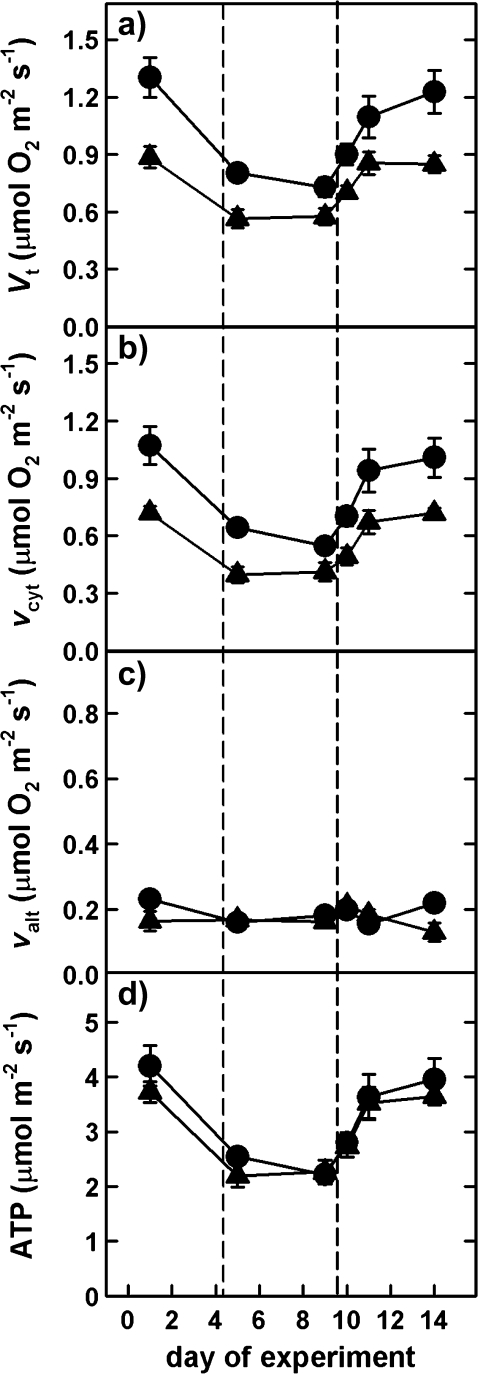
Fig. 2.
Changes of total respiration (Vt), cytochrome (vcyt), and alternative (valt) pathway activities, as well as modelled mitochondrial ATP production during drought stress and rewatering in WT (triangles) and CMSII (circles) plants. Values of control plants remained unaltered throughout the experiment and are therefore not depicted. Means and standard errors of at least four plants are shown. The vertical dashed lines indicate the beginning and end of the severe drought period.

