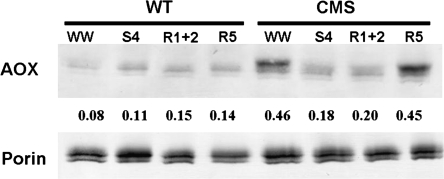
Fig. 3.
Western blot analysis of mitochondrial alternative oxidase (AOX) and porin protein in WT and CMSII during drought stress and rewatering. WW, S4, R1+2, and R5 denote for the start of the experiment (well-watered), end of severe drought stress, initial phase (first and second day), and terminal phase (fifth day) of rewatering, respectively. The values below the AOX bands represent the ratio of AOX and porin quantified by densitometry. Each lane was loaded with the same amount of protein of combined leaf extracts from four plants.

