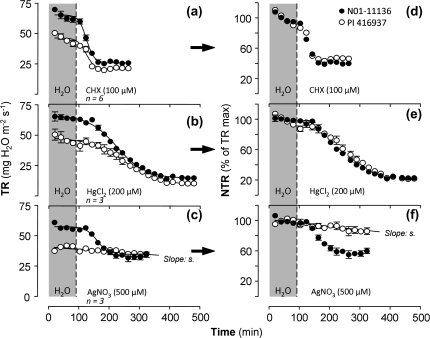
Fig. 5.
Examples of time-courses of transpiration rate (TR) response to the three different AQP inhibitors: 100 μM CHX (a, d), 200 μM HgCl2 (b, e), and 500 μM AgNO3 (c, f) under constant, high VPD conditions for two de-rooted soybean genotypes (N01-11136: closed circles and PI 416937: open circles). Grey areas highlight the 80 min sequence where maximum TR values (TR0) were measured under de-ionized water treatment. (a–c) Time-courses of absolute TR. (d, f) Time-courses of the corresponding normalized TR values (NTR, expressed in % of the average of TR maximum values, see Materials and methods for details). The number of replicate plants (n=3–6 ±SE) are indicated. Error bars for some points are invisible when they are smaller than the size of the symbols. Curves on (a), (b) and (c) are Bolzmann sigmoidal fittings.

