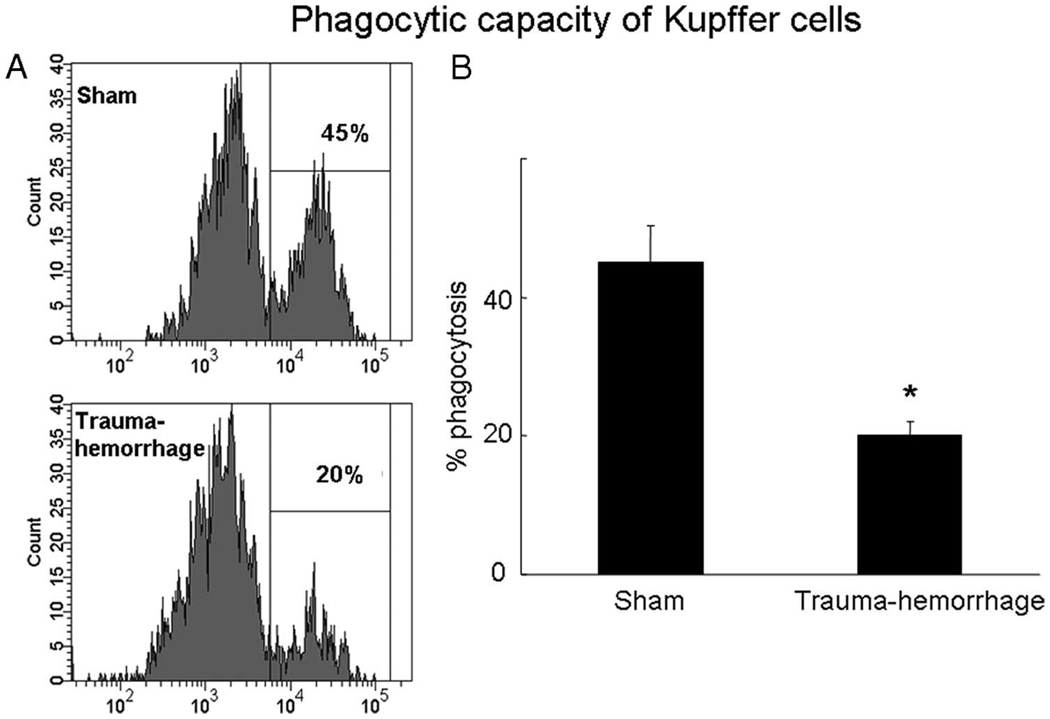
FIGURE 1.
Kupffer cell phagocytic capacity following trauma-hemorrhage. Mice were subjected to sham operation or trauma-hemorrhage. In vivo phagocytosis assays were performed by injection of E. coli bioparticles at the beginning of resuscitation. Kupffer cells were harvested 2 h after resuscitation and analyzed by flow cytometry as described in Materials and Methods. A, The gated region and percentage shown in the representative histogram indicates the percentage of Kupffer cells that had ingested bioparticles. B, The percentage of phagocytosis in sham and trauma-hemorrhage groups. Data are shown as mean ± SE for n = 6 animals/ group. *, p < 0.05 compared with sham.

