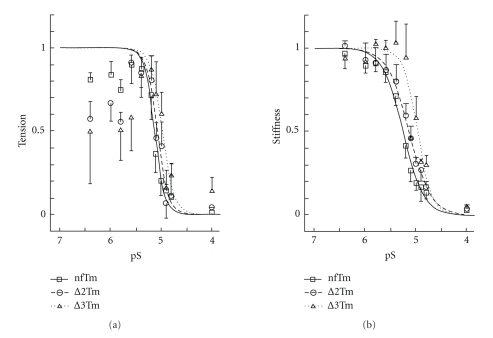
Figure 4.
pS-tension curves. pS-tension plot (S = [MgATP2−]) in (a) and pS-stiffness plot in (b) comparing nfTm, ∆2Tm, and ∆3Tm. The stiffness data were fitted to (2), and continuous lines are drawn based on best-fit parameters. The tension data in (a) are fitted to an equation similar to (2), where only the data to the right of the peak are used for fitting. The experiments were carried out at 8 mM Pi, and in the absence of Ca2+. Error bars represent SEM. N = 5 for nfTm and ∆2Tm, and N = 4 for ∆3Tm.

