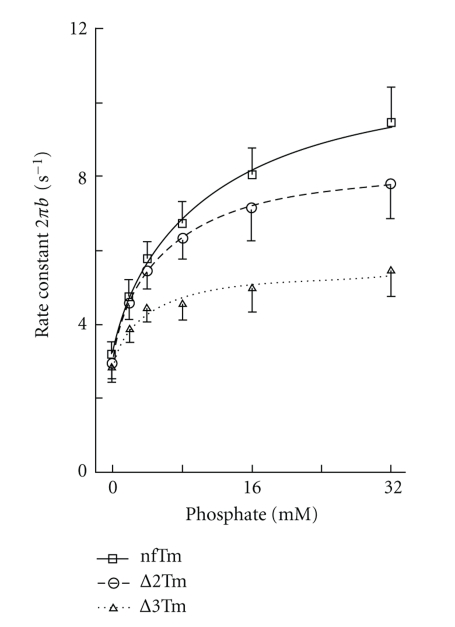
Figure 7.
The effect of Pi on the apparent rate constant 2πb. To deduce the rate and association constants of steps 4 and 5, the results of Figure 7 were fitted to (6). The MgATP concentration was kept at 5 mM. The continuous lines are based on (6) with best-fit parameters. σ of (7) was calculated based on the K 1 and K 2 obtained from the MgATP study (Table 5) and at S = 5 mM.

