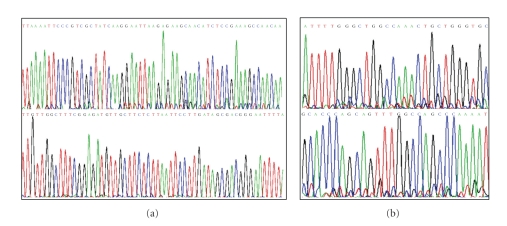
Figure 2.
Chromatograms of PCR products. (a) graphs displaying exon 19 sense and antisense strands on top and bottom, respectively. (b) Graphs displaying exon 21 sense and antisense strands on top and bottom respectively. In both exons 19 and 21 no significant double peaks were obtained signifying the absence of any mutations within these reading frames.

