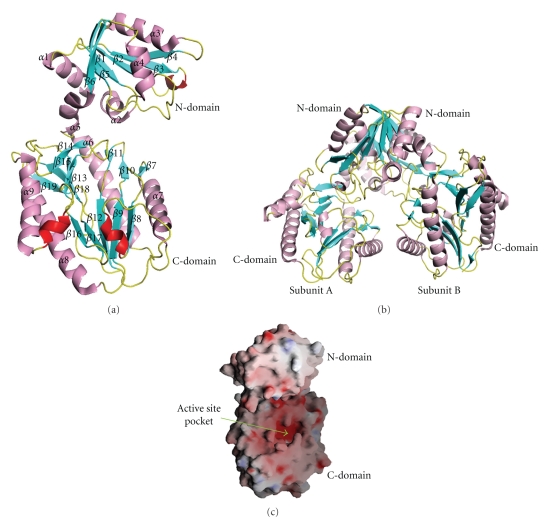
Figure 1.
(a) Ribbon diagram of Phdpd (monomer form) showing N and C-terminal domains. α-helix, 310-helices, β-strands, and loops colored magenta, red, cyan, and yellow, respectively. The figure was made by the programs MOLSCRIPT and Raster3D [20, 21]. (b) Dimer form of Phdpd. (c) Electrostatic potential surface of the Phdpd and its active site pocket. The positively and the negatively charged surface regions are noted in blue and red, respectively.

