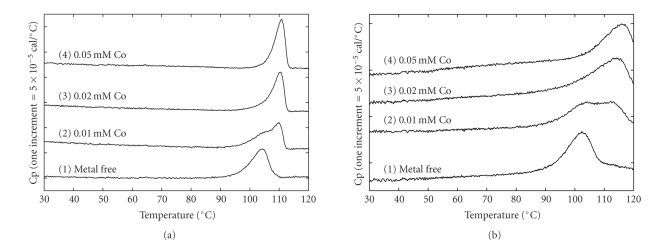
Figure 3.
DSC curves of Phdpd and Zn-Phdpd in various concentrations of Co ion. (a) and (b) represent the DSC curves of Phdpd and Zn-Phdpd, respectively. All protein concentrations were 0.01 mM. DSC curves 1, 2, 3, and 4 were measured in the presence of 0, 0.01, 0.02, and 0.05 mM Co, respectively, in 50 mM Tris buffer at pH 7.8. The scan rate was 100 Kh−1.

