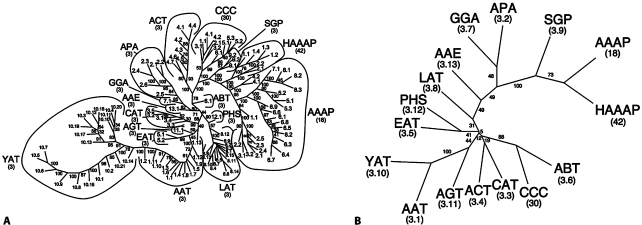
Fig. 4.
Phylogenetic (Fitch) trees for the APC superfamily [Jack et al., 2000]. The trees were generated with (A) the SFT1 program and (B) the SFT2 program. A The tree presents the relationships of all proteins of the APC superfamily as of June, 2008. These include all 16 families of the APC superfamily as indicated by their three letter abbreviations as defined in TCDB. Numbers refer to the individual TC numbers of the proteins within the various families. Bootstrap values are provided adjacent to each branch. The same convention is also used for figures 4B, 5D and 6B below. B A FITCH tree of the entire APC superfamily generated with the SFT2 program. The tree reveals the phylogenetic relationships of the 16 families relative to each other.

