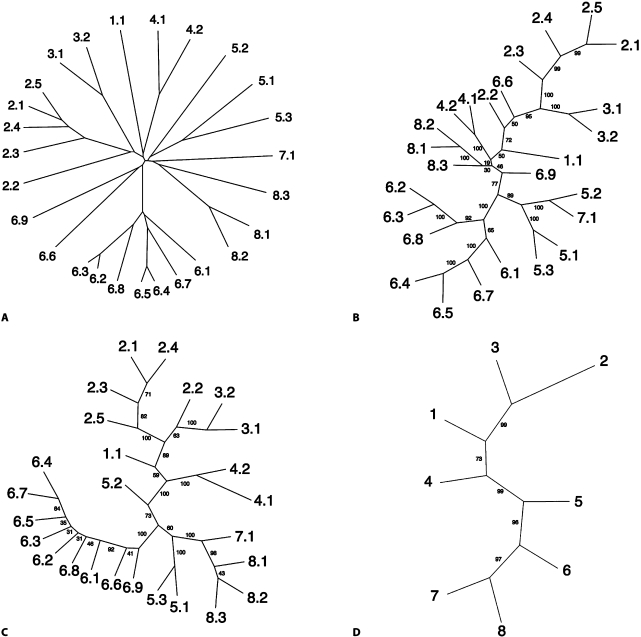
Fig. 5.
Phylogenetic trees generated with four programs for the AAAP family [Young et al., 1999] within the APC superfamily. A CLUSTAL X-TREEVIEW-neighbor joining tree. B Parsimony (Protpars) tree based on the CLUSTAL X-generated multiple alignment. C The corresponding tree generated with the SFT1 program. D The tree generated with the SFT2 program. The SFT1-based tree (C) and the SFT2-based tree (D) show the eight subfamilies of the AAAP family. Note: this tree resembles the AAAP cluster for the APC superfamily tree shown in figure 4A. All members in TCDB included in the eight AAAP subfamilies (C) were averaged to provide the positions of each of these subfamilies relative to each other (D).

