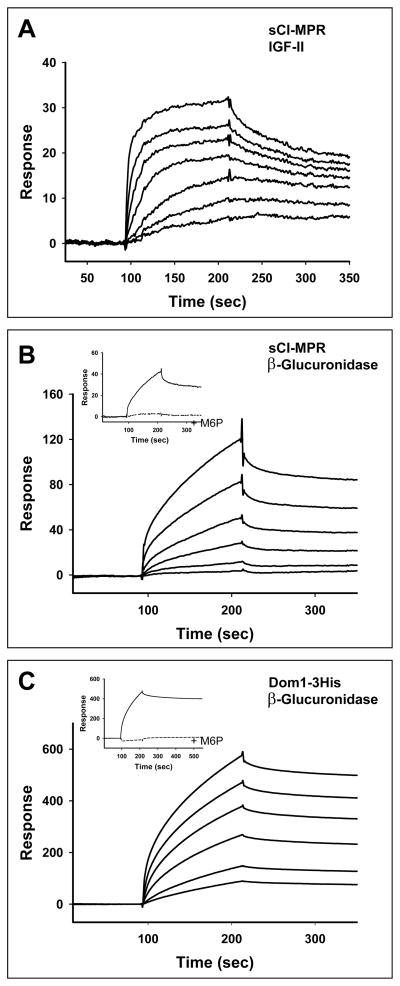
FIGURE 2. Sensorgrams measuring the interaction between the MPRs (sCI-MPR or Dom1-3His) and IGF-II or a lysosomal enzyme.
The sCI-MPR and Dom1-3His proteins were coupled to separate flow cells of a CM5 sensor chip, with a final coupling level of 2600 and 1000 response units (RU), respectively. Increasing concentrations of IGF-II or the lysosomal enzyme, β-glucuronidase, were injected onto the chip. (A) Sensorgrams show the interaction between the sCI-MPR and IGF-II (1, 2.5, 5, 10, 25, 50, and 100 nM). (B) Sensorgrams depict the interaction between β-glucuronidase (0.5, 1, 2.5, 5, 10, 25, 50, and 100 nM) and the sCI-MPR or (C) Dom1-3His. The insets in panels B and C are sensorgrams showing the interaction between β-glucuronidase (50 nM) and sCI-MPR or Dom1-3His, respectively, in the absence or presence of 10 mM Man-6-P.

