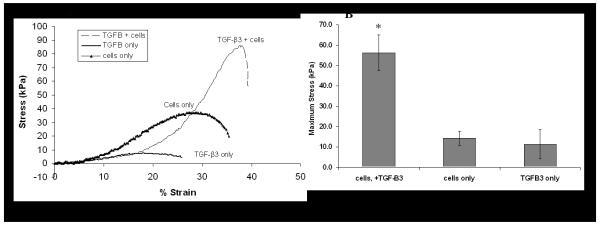
Figure 3.
Push-out mechanical testing of interface strength. (A) The stress-strain curve obtained at day 21 showed highest level of integration in the TGF-ß3 and cells group. (B) Mean maximal stress values (n = 5) were seen in the TGF-ß3 plus cells group, while the cells only and TGF-ß3 only groups showed similar values (*, p<0.05, compared to TGF-ß3 only or cells only group).

