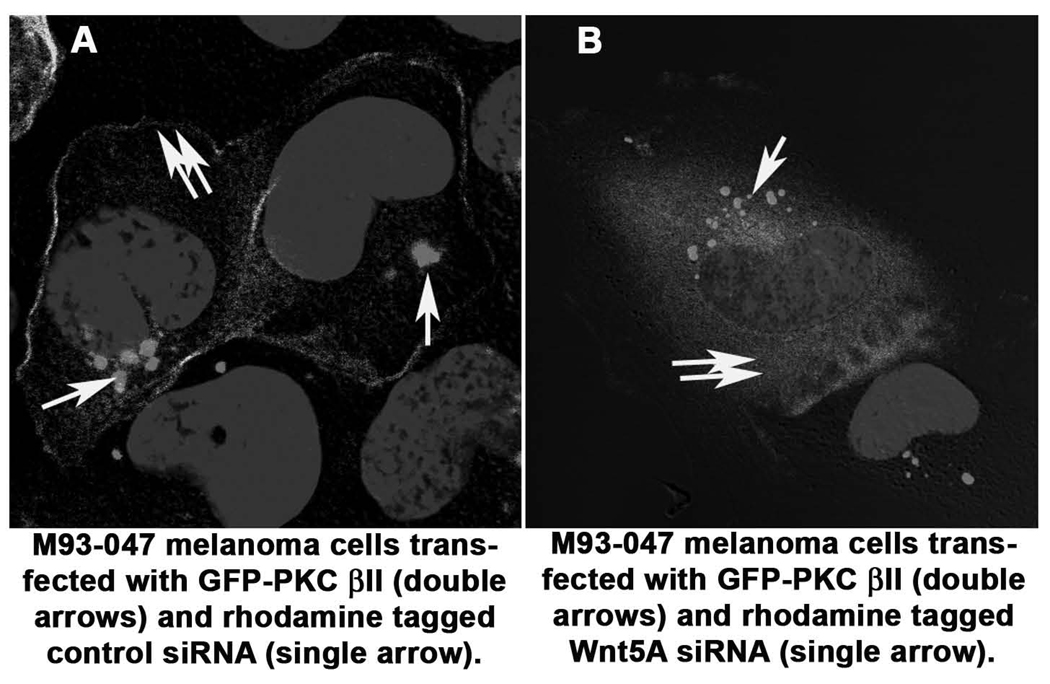
Figure 1. Confocal Microscopy for PKC Activation.
Using a GFP-tagged PKCβII expression vector, cells were treated with either control siRNA or siRNA against Wnt5A. In cells co-transfected with a control siRNA (single arrow), PKC (double arrows) remains at its active site in the membrane (A). When these cells are cotransfected with siRNA against Wnt5A (single arrow), PKC (double arrows) moves into the cytoplasm (B).

