
Figure 2.
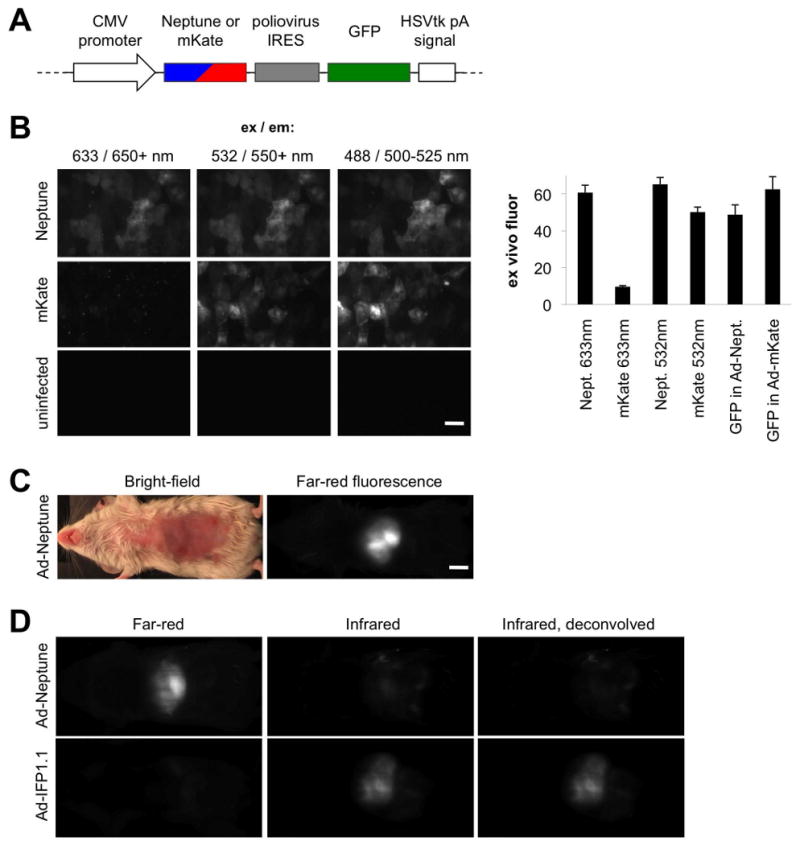
Performance of Neptune in cells and animals. (A) Design of a monocistronic adenovirus vector for coexpression of GFP and Neptune (Ad-Neptune) or (Ad-mKate) in hepatocytes. (B) Sections of liver were removed from a mouse injected with Ad-Neptune or Ad-mKate and imaged at red or far-red wavelengths on a confocal microscope. GFP was also imaged to confirm expression of the cistron. Fluorescence intensities are shown in the chart. Scale bar, 50 μm. (C) Epifluorescence of Neptune in the liver of a living mouse acquired on a Maestro imaging system (CRI) with excitation and emission at 610-630 nm and 660-700 nm, respectively. Scale bar, 5 mm. (D) Dual fluorescence imaging in the optical window is possible with Neptune and infrared fluorescent protein (IFP). Images of live mice expressing Neptune or IFP1.1 in liver were acquired with Cy5 and Cy5.5 channels. Excitation/emission wavelengths used were 610-630/660-700 nm for Cy5 and 625-675/700-730 nm for Cy5.5. In the right column, spectral unmixing was used to correct for Neptune cross-excitation and -detection in the Cy5.5 channel. Restricting IFP excitation to above 650 nm with custom filters would produce similar results.