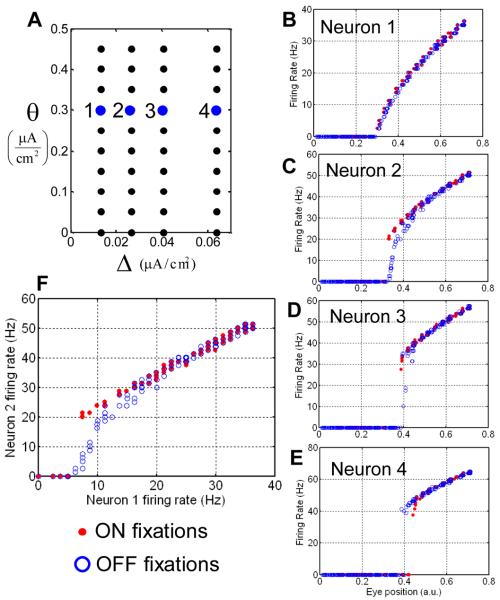
Figure 11.
Reversal of hysteresis in the network of Hodgkin-Huxley neurons. (A) The arrangement of 40 neurons in the parameter space of hysteresis positions and half-widths. (B-E) The firing rate traces for four example neurons indicated in (A). The red/blue markers display values obtained after ON/OFF saccades. (B) for some neurons the observed hysteresis is small, similarly to some experimental observations (Figure 1A). (C and D) For neurons 2 and 3 the red dependence is above the blue one. These neurons belong to groups G1 or G2 defined in Figure 9 and display reversed hysteresis (compare to Figure 1B) (E) Neuron 4 belongs to G4. (F) Firing rate of one neuron versus the other [(B) versus (A)] displays hysteresis, as observed experimentally (Aksay et al., 2003).

