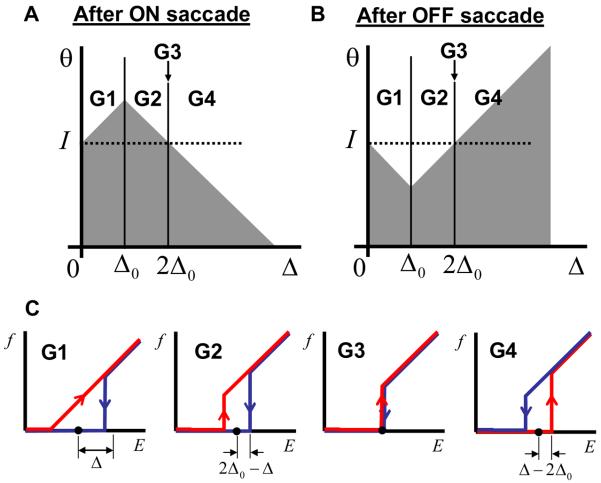
Figure 9.
The firing rate as a function of eye position during fixations for different groups of neurons (G1-4). (A) and (B) the activation functions after the ON and OFF saccades respectively. (C) Firing rate as a function of eye position for neurons from four groups (G1 to G4) indicated in (A). The red and blue curves correspond to the preceding ON and OFF saccades respectively.

