
Figure 6.
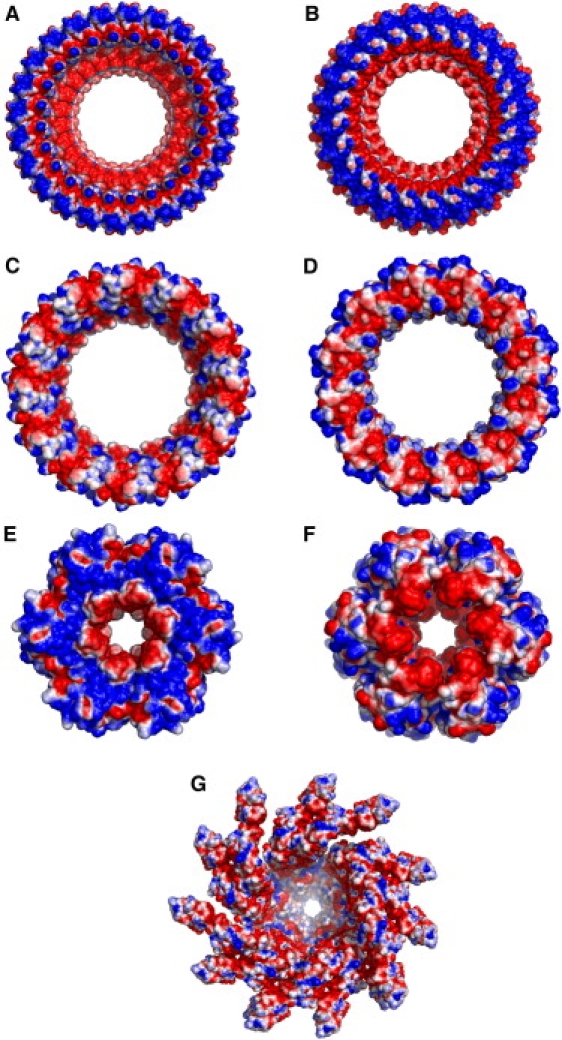
Surface electrostatics of the (A and B) EscJ, (C and D) EscC, (E and F) EscN, and (G) flagellar filament. Note that the visual scaling is different between of them. The electrostatic potentials are calculated by the PBEQ module (19) in CHARMM and visualized on the solvent-accessible surface using PyMOL (41). Electrostatic scaling used for all the figures is −0.6 (red) to 0.6 kcal/(mol·e) (blue).