
Figure 3.
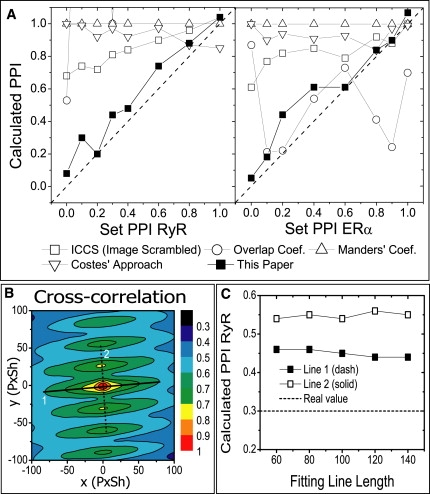
Analysis of computer-simulated images based on biological images. (A) Comparison of quantitative colocalization analysis method over a broad range of colocalization value and concentration ratio, for computer-simulated images using Fig. 2, A and B, as layout. The set (PRyR, PERα) values are (0, 0), (0.1, 0.9), (0.2, 0.1), (0.4, 0.2), (0.3, 0.6), (0.4, 0.2), (0.6, 1), (0.8, 0.4), and (1, 0.8). Results of a better method should form a line closer to the Set PPI = Calculated PPI value (dash). (B) Contour plot of the cross-correlation function of one of the simulated images. Double-Gaussian fit could be performed along either line 1 (solid) or line 2 (dash). (C) Impact of fitting line choice to PPI result. The length of fitting line has little effect, but one needs to choose line 1 to obtain a better estimate to the real PPI value.