
Figure 6.
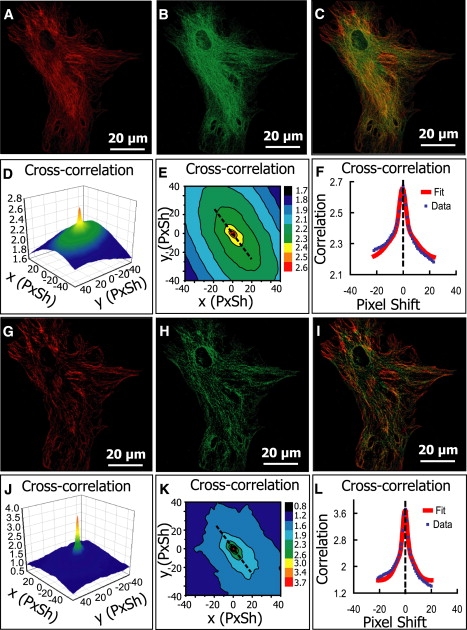
Analysis of images of a mouse brain cell (astrocyte) where two different proteins were independently labeled. (A) MaxiK-α channel (1520 × 1520). (B) α-tubulin channel (1520 × 1520). (C) Overlay of A and B. (D–F) Cross-correlation function and the nonlinear fit; estimated PPI is 0.56 for MaxiK-α, 0.51 for α-tubulin, and Pearson's coefficient is 0.63. (G–L) Equivalent analysis after median-filter background reduction. PPI is 0.37 for MaxiK-α, 0.47 for α-tubulin, and Pearson's coefficient is 0.42.