
Figure 7.
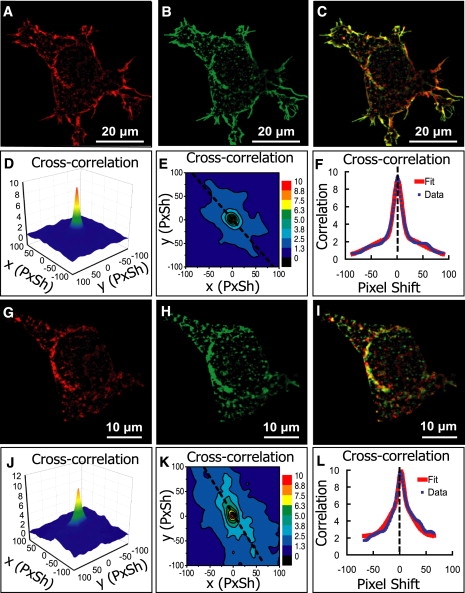
Analysis of images of a human embryonic kidney 293 cell (HEK 293T) where c-Src tyrosine kinase and serotonin receptor subtype 5-HT2AR were coexpressed and independently labeled. (A) c-Src channel after median filter processing (1070 × 1070). (B) 5-HT2AR channel after median-filter processing (1070 × 1070). (C) Overlay of A and B. (D–F) Cross-correlation function and the nonlinear fit; estimated PPI is 0.72 for c-Src, 0.91 for 5-HT2A receptors, and Pearson's coefficient is 0.81. (G–L) Equivalent analysis after the cell membrane was removed. PPI is 0.42 for c-Src, 0.55 for 5-HT2AR, and Pearson's coefficient is 0.48. Lower PPI values inside the cell indicate that c-Src and 5-HT2AR are more strongly colocalized on cell membrane.