
Figure 4.
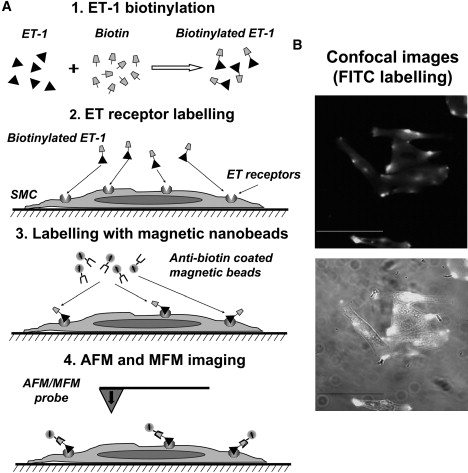
Method for visualizing ET receptors in biotinylated cultured SMCs, and AFM/MFM imaging verified by confocal microscopy. (A) Schematics of the experimental procedure. The key steps include biotinylation of ET-1 (step 1), labeling of the surface ET receptors with bET-1 (step 2), labeling of bET-1 bound to the receptor with anti-biotin-coated superparamagnetic microbeads (step 3), and imaging of the labeled receptors with AFM/MFM (step 4). (B) Confocal imaging of cultured cells treated with 100 nM bET-1-and then labeled with anti-biotin FITC-conjugated antibodies instead of anti-biotin-coated superparamagnetic microbeads. The bottom panel shows superimposed fluorescent and transmitted light images. Scale bars are 50 μm.