
Figure 5.
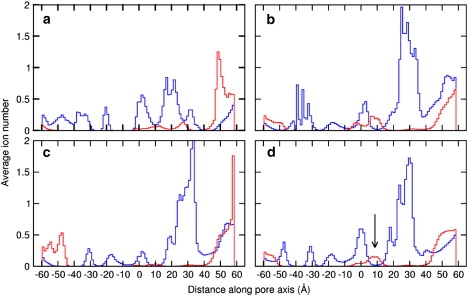
Na+ (solid blue) and Cl− (dashed red) distribution in the (a) ELIC, (b) GLIC1, (c) GLIC1M, and (d) GLIC2 channel interior. The location of Cl− in the EC domain of GLIC2 is highlighted by the arrow.
Official websites use .gov
A
.gov website belongs to an official
government organization in the United States.
Secure .gov websites use HTTPS
A lock (
) or https:// means you've safely
connected to the .gov website. Share sensitive
information only on official, secure websites.
Na+ (solid blue) and Cl− (dashed red) distribution in the (a) ELIC, (b) GLIC1, (c) GLIC1M, and (d) GLIC2 channel interior. The location of Cl− in the EC domain of GLIC2 is highlighted by the arrow.