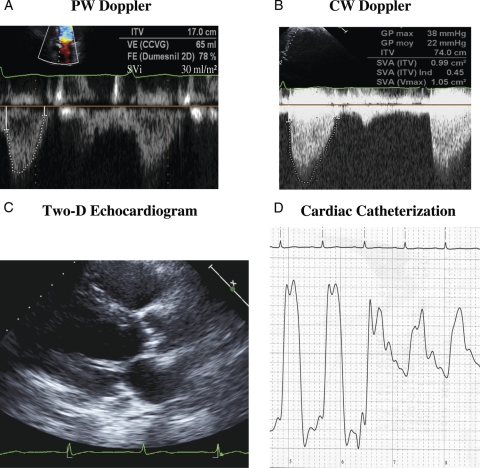
Figure 1.
Illustrative case of patient with PLF AS. (A) Pulse wave (PW) Doppler tracing in LV outflow tract; ITV, time velocity integral; VE, stroke volume; FE, ejection fraction; SVi, stroke volume index. (B) Continuous wave (CW) Doppler tracing through aortic valve; GP, pressure gradient; SVA, aortic valve area; SVAind, aortic valve area indexed for body surface area. (C) Two-dimensional echocardiogram in the parasternal long-axis view in diastole showing heavily calcified valve and small LV with concentric hypertrophy. (D) Pullback pressure tracing from LV to aorta; see text for details.

