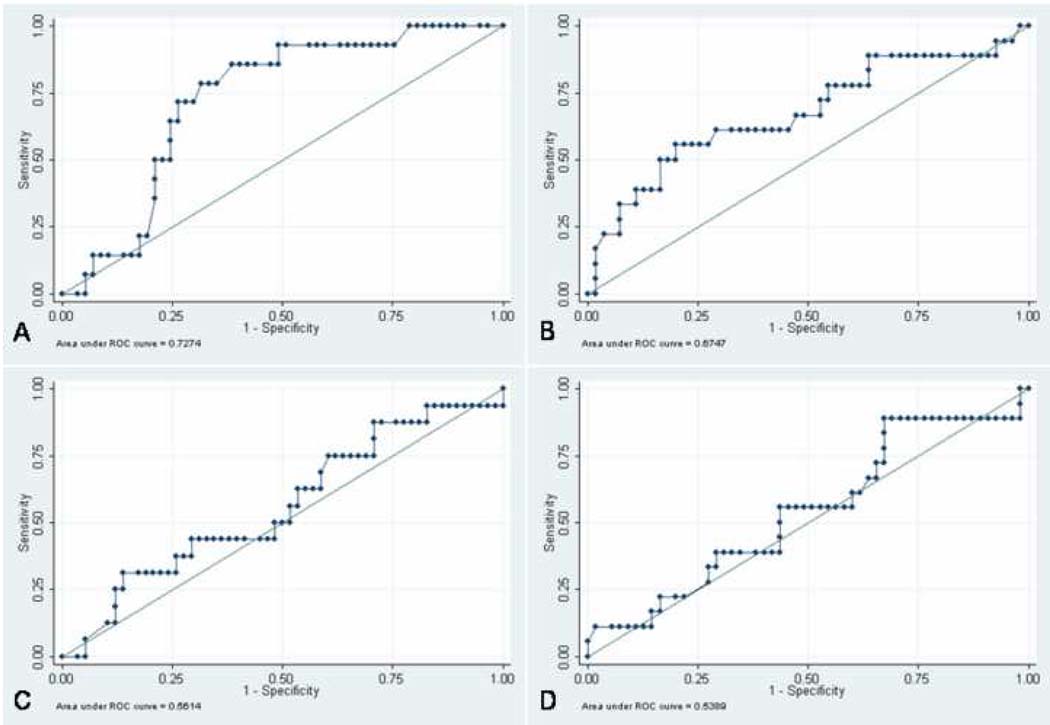
Figure 2. Predictors of FET Success: Area Under the Receiver-operating Curve (AUC) for Serum Hormone Levels During COH.
A) Serum P on the day of hCG: AUC=0.73 (95% CI= 0.60 to 0.86),
B) post-hCG P: AUC= 0.67 (95% CI= 0.52 to 0.83),
C) E2 on the day of hCG: AUC= 0.56 (95% CI = 0.40 to 0.72),
D) post-hCG E2 :AUC= 0.54 (95% CI = 0.38 to 0.7).
The difference between these areas and the reference area of 0.5 was significant for serum P on the day of hCG (p= 0.0005) and serum P post hCG (p=0.03)

