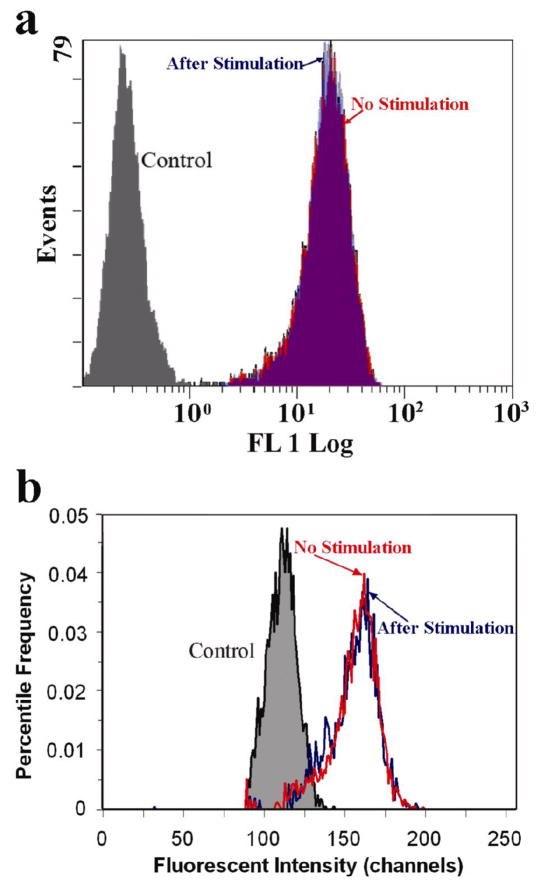
Figure 3.
The histograms of the fluorescent intensity of SykEGFP-DT40-Syk−-Lyn− cells with and without stimulation by anti-IgM antibody and the DT40-Syk−-Lyn− cells (the control). (a) Histograms obtained by Cytomics FC 500 Flow cytometer (Red: without stimulation; Blue: stimulated by anti-IgM; Grey: the control, DT40-Syk−-Lyn− cells without EGFP labeling). The data generated by dead cells (determined based on scatter properties) were excluded from the analysis. (b) Analysis of the same samples as in (a) in the microfluidic device (with the voltage at 0). To eliminate the effect of different cell sample sizes on the shape of the histograms, the distributions were normalized to have percentile frequency (the frequency divided by the total number of observations) for the y-axis.

