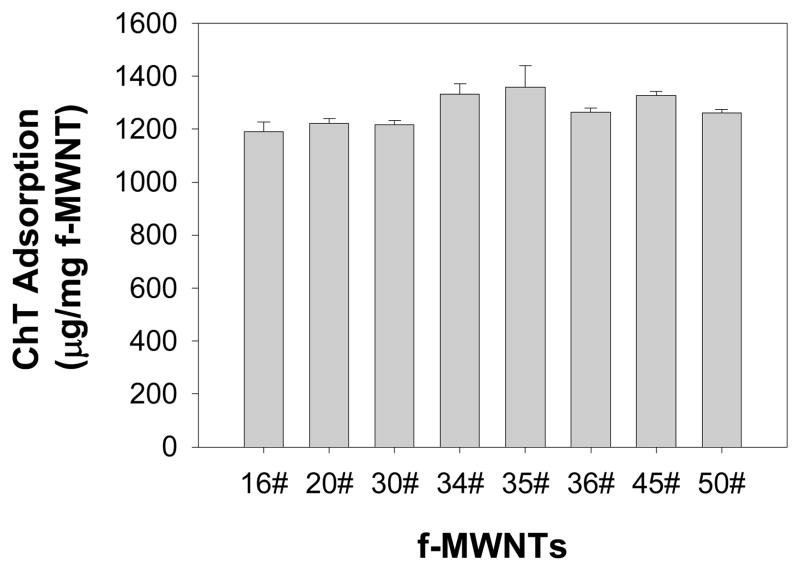
Figure 2.
Quantification of adsorbed ChT onto MWNTs by HPLC assay. The free ChT was determined by HPLC based on a standard calibration curve. The adsorbed proteins were derived from the difference between the total proteins used in the assay and the free proteins. Error bars are the standard deviations from three measurements. The final f-MWNTs’ concentration was 150 μg/mL and the ChT concentration was 250 μg/mL. Experimental details are in section 1.5 of Supporting Information.

