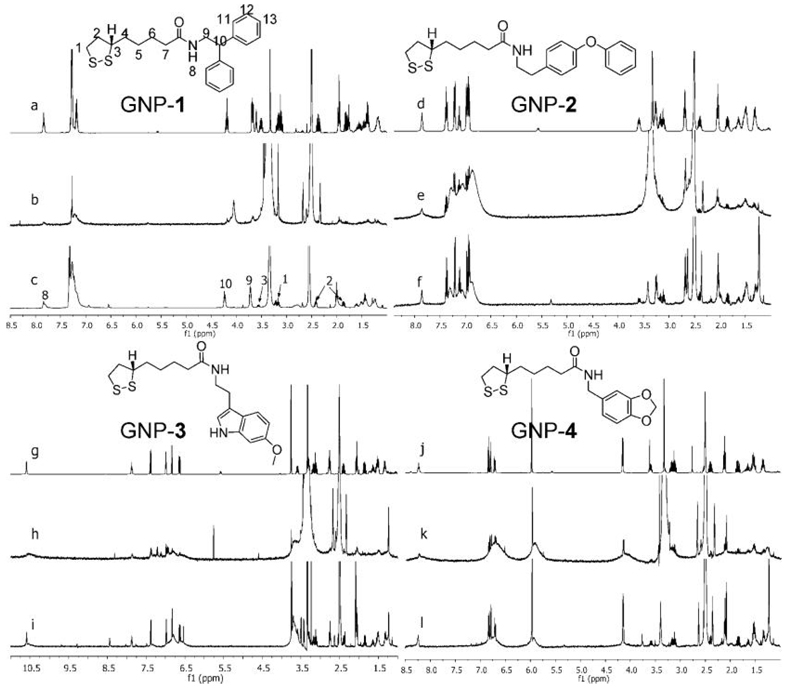
Figure 3.
1H NMR spectra of free ligands 1–4 and GNP-1-4 in DMSO-d6. In each group, the top spectra (a, d, g, j) are the solution 1H NMR spectra of free ligands (structures shown), the middle ones (b, e, h, k) are solution 1H NMR spectra of corresponding GNPs and the bottom ones (c, f, i, l) are 1H HRMAS NMR spectra. (Reprinted with permission from [58], © 2008 American Chemical Society)

